Negative regulation of CDKN1A by the histone methyltransferase EHMT2 for cell growth in colorectal cancer
Article information

Abstract
Background
Epigenetic regulation of oncogenes and tumor suppressor genes by histone methyltransferases is an important process for colon cancer growth and metastasis. Although various epigenetic modifiers have been recognized as attractive therapeutic targets for colon cancer treatment, alternative epigenetic regulation in colon cancer for reducing side effects and increasing effectiveness of treatments has not been thoroughly explored.
Methods
To identify the overexpression of EHMT2 in colon cancer, we used the RNA-sequencing (RNA-seq) results (normal, n=41; tumor, n=286) derived from the The Cancer Genome Atlas (TCGA) portal. And we performed a 3-dimensional (3D) culture system for generating cell spheroids to assess the functions of EHMT2 in colon cancer, and using chromatin immunoprecipitation assays and RNA-seq results, we suggested EHMT2 direct target in colon cancer.
Results
In this study, we identified CDKN1A as a direct target for EHMT2 by RNA-seq and found increased growth suppression via upregulation of CDKN1A by EHMT2 knockdown. In addition, using a 3D culture system for spheroid formation with a ULA plate, we confirmed EHMT2-related growth suppression and CDKN1A regulation.
Conclusion
We suggest that EHMT2 is a therapeutic target for colon cancer treatment, and the development of an EHMT2 inhibitor is needed for the effective treatment of colon cancer.
Introduction
Colon cancer is the third most common cancer in the world. Although various targeted therapies and chemotherapies are used for colon cancer treatment [1–3], severe side effects and low effectiveness have been recognized as serious problems in overcoming therapeutic hurdles. Thus, there continues to be a need for the development of alternative novel therapeutic targets for colon cancer treatment.
EHMT2 is a histone methyltransferase that methylates histone H3 lysine 9 (H3K9), resulting in the formation of heterochromatin structures. H3K9 methylation by EHMT2 in promoter regions suppresses gene expression, and its methylation is associated with a reduction in the expression of tumor suppressor genes, which helps maintain cancer cell proliferation in several types of cancers [4–8]. In glioma cancer stem cells (CSCs), inhibition of EHMT2 enhanced the self-renewal function of CSCs [9]; however, EHMT2 knockdown induced cell apoptosis via upregulation of TNFAIP1 expression in colon cancer [4], and FOXO1 methylation by G9a promoted colon cancer proliferation [10]. Although EHMT2 is recognized as an effective colon cancer target, the mode of action (MOA) of EHMT2 is not fully understood.
Thus, in this study, we identified EHMT2 as a direct target for colon cancer treatment via RNA-sequencing (RNA-seq) analysis and chromatin immunoprecipitation (ChIP) assays and performed a functional analysis using a 3-dimensional (3D) cell line-based spheroid culture system. Finally, we clearly suggest that EHMT2 is a therapeutic target that should be explored in the development of colon cancer inhibitors. In addition, the specific downregulation of EHMT2 expression by small interfering RNA (siRNA) or miRNA is expected to be an effective treatment method to reduce several side effects of colon cancer treatment.
Materials and Methods
Ethics statement: This study was a literature review of previously published studies and was therefore exempt from institutional review board approval.
1. Cell culture and reagents
A human colorectal cancer (CRC) cell line, HCT116, was purchased from the Korean Cell Line Bank and cultured in RPMI-1640 medium supplemented with 10% fetal bovine serum (FBS) and 1% penicillin/streptomycin in a humidified atmosphere with 5% CO2 at 37°C. BIX01294 (ab141407) was purchased from Abcam (Cambridge, United Kingdom).
2. siRNA transfection
For siRNA transfection, HCT116 cells were seeded in plates and incubated for 24 hours. The targeting or control siRNAs (Bioneer, Daejeon, Korea) were transfected into HCT116 cells at 100 nM using RNAiMax (Invitrogen, Waltham, MA, USA) for 48 hours. The sequences of siRNAs used were as follows: siCont (5' AUGAACGUGAAUUGCUCAATT 3', 5' UUGAGCAAUUCACGUUCAUTT 3'), siEHMT2 (5' GCAAAUAUUUCACCUGCCATT 3', 5' UGGCAGGUGAAAUAUUUGCTT 3'), siCDKN1A (5' CUGUACUGUUCUGUGUCUU 3', 5' AAGACACAGAACAGUACAG 3').
3. Cell viability assay
A Cell Counting Kit-8 (CCK-8) (E-CK-A361; Elabscience, Houston, TX, USA) was used to conduct the cell viability assays. HCT116 cells were seeded in 6-well plates at 2×10⁵ cells/well and incubated for 24 hours. After siRNA transfection for 48 hours, the CCK-8 solution and RPMI-1640 medium with 10% FBS were added to each well, and the plates were incubated under 5% CO2 at 37°C for 5 minutes. The absorbance was assessed using a microplate reader at 450 nm. For crystal violet staining, the cells were fixed with methanol for 5 minutes and stained with 0.1% crystal violet after siRNA transfection for 48 hours.
4. Quantitative real-time polymerase chain reaction
Total RNA was isolated from HCT116 cells using a Qiagen RNeasy Mini Kit (Qiagen, Hilden, Germany) according to the manufacturer’s instructions. RNA aliquots of 1 µg were then reverse-transcribed using PrimeScript RT Master Mix (RR036A; Takara, Kusatsu, Japan) according to standard protocols. Quantitative real-time polymerase chain reaction (RT-PCR) was performed using the AriaMx Real-Time PCR System (Agilent Technologies, Santa Clara, CA, USA) following the manufacturer’s instructions. Quantitative RT- PCR was performed on cDNA samples using a SensiFAST SYBR Lo-ROX Kit (Meridian Bioscience Inc., Cincinnati, OH, USA), and the signal was detected by an AriaMx Real-Time PCR System (Agilent Technologies). The fluorescence threshold value was calculated using Agilent Aria 1.6 software. The PCR primers used were as follows: EHMT2 (forward, 5' GAGAACATCTGCCTGCACTG 3' and reverse, 5' GTTGACAGCATGGAGGTCAC 3'), CDKN1A (forward, 5' CTTTGTCACCGAGACACCAC 3' and reverse, 5' CAGGTCCACATGGTCTTCCT 3'), CDH1 (forward, 5' CGAGAGCTACACGTTCACGG 3' and reverse, 5' GGGTGTCGAGGGAAAAATAGG 3'), ACTB (forward, 5' ACTCTTCCAGCCTTCCTTCC 3' and reverse, 5' CAATGCCAGGGTACATGGTG 3').
5. Chromatin immunoprecipitation
ChIP was performed with a Simple ChIP Plus Sonication Chromatin IP Kit (#56383S; Cell Signaling Technology, Danvers, MA, USA) following the manufacturers’ instructions. HCT116 cells transfected with siCont and siEHMT2 for 48 hours were crosslinked with 1% formaldehyde (Sigma-Aldrich, St. Louis, MO, USA) for 10 minutes at room temperature and quenched with 1X glycine for 5 minutes at room temperature. Then, the cells were washed with cold 1X PBS (containing 1X protease inhibitor cocktail), and the cells were lysed in 1X cell lysis buffer (containing a 1X protease inhibitor cocktail). Then, after nuclear extraction, the chromatin solution was sonicated using a Bioruptor Pico sonication device (B01060010; Diagenode, Danville, NJ, USA) with 10 cycles of 30 seconds on and 30 seconds off to obtain 200 to 1,000 bp chromatin fragments. Sheared chromatin (approximately 5 to 10 µg) was incubated with 2 μg of anti-H3K9me2 ChIP grade antibody (ab1220; Abcam) at 4°C overnight. Then, complexes were incubated with 30 μL of ChIP-Grade Protein G Magnetic Beads for 2 hours at 4°C. Then, the complexes were washed after each step, incubated with ChIP elution buffer for 30 minutes at 65°C and incubated with proteinase K for 2 hours at 65°C. After DNA purification using spin columns, the samples were analyzed by quantitative RT- PCR using CDKN1A primers. The primers used for the ChIP assay were as follows: primer 1 Primer 1 (P1) forward, 5’-TCCACCTTTCACCATTCCCC-3’ and reverse, 5’-GTTGGGACATGTTCCTGACG-3’; Primer 2 (P2) forward, 5’-CACGCCCGGCCAGTATATA-3’ and reverse, 5’-C TCCCGAGTAGCTGGGATTAC-3’; Primer 3 (P3) forward, 5’-CTCTTCGAGGCCAGCATTG-3’ and reverse, 5’-GATGTACATGCTCCCGCAGA-3’.
6. 3D spheroid culture
To perform spheroid culture of HCT116 cells, ultralow attachment (ULA) microplates were used (7007; Corning, Corning, NY, USA). After siRNA transfection for 48 hours, cells were seeded into plates at concentrations of 5×10⁴ cells per well. The spheroids were cultured for 2 days and observed under a microscope (CKX53; Olympus Corporation, Tokyo, Japan). To check the effect of BIX01294, HCT116 cells were seeded into plates at concentrations of 5×10⁴ cells per well and incubated for 24 hours. Subsequently, cells were treated with 20 µM BIX01294 and cultured for 2 days. Then, the spheroids were observed under a microscope (CKX53; Olympus Corporation).
7. RNA-seq and analysis
Using a TruSeq RNA Sample Preparation Kit V2, purification and library construction were conducted with total RNA, and Illumina HiSeq 2500 machines (Illumina, San Diego, CA, USA) were used for sequencing with a read length of 2×10² bases. FastQC ver. 0.11.4 was used to assess the quality of the paired-end reads. Cutadapt version 1.15 and Sickle version 1.33 were used to filter low-quality reads and adaptors. Cufflinks version 2.2.1 was used to calculate fragments per kilobase of transcripts per million mapped reads values. Cuffdiff was used to select differentially expressed genes (DEGs). Gene Ontology (GO) and Kyoto Encyclopedia of Genes and Genomes (KEGG) pathway enrichment analyses were performed using DAVID ver. 6.8.
Results
1. Downregulation of EHMT2 suppressed cell growth in the colon cancer cell line HCT116
In The Cancer Genome Atlas (TCGA) portal, the expression of EHMT2 was significantly increased in colon cancer (n=286) compared to normal tissues (n=41) (Fig. 1A). To assess the relationship between EHMT2 and colon cancer, we designed EHMT2-specific siRNA (siEHMT2) and negative control siRNA (siCont). After treatment of HCT116 cells with siEHMT2, we clearly found growth suppression in CCK-8 and crystal violet analyses (Fig. 1B and 1C). Thus, we suggest that the overexpression of EHMT2 is associated with colon cancer growth. Next, to identify the functions of EHMT2 in colon cancer, we performed total RNA-seq analysis after treatment with siEHMT2 and siCont. Using 1505 DEGs, we performed GO and KEGG pathway enrichment analyses with DAVID ver. 6.8. Fig. 1D shows that the GO terms and KEGG pathways were enriched in apoptosis and cell cycle. Thus, we hypothesized that EHMT2 expression is closely related to colon cancer proliferation.
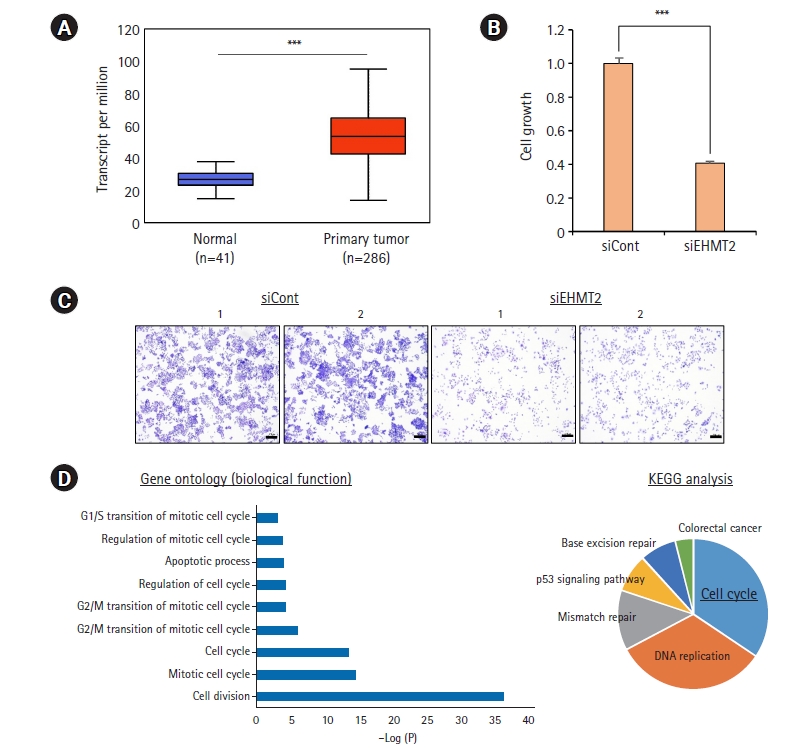
EHMT2 is upregulated in colorectal cancer. (A) Box plot of EHMT2 expression in colorectal cancer and normal samples from The Cancer Genome Atlas. p-values were calculated using the Student t-test (***p<0.001) (http://ualcan.path.uab.edu/index.html). (B) Cell viability assay after treatment with siEHMT2 and siCont for 48 hours. HCT116 cells were incubated for 5 minutes at 37°C after adding Cell Counting Kit (CCK)-8 solution. The intensity of cell viability was measured using a microplate reader (450 nm). Mean±standard deviation of three independent experiments. p-values were calculated using the Student t-test (***p<0.001). (C) Cell growth assay after treatment with siEHMT2 and siCont for 48 hours. HCT116 cells were fixed in 100% methanol and stained with crystal violet solution. Scale bar, 200 µm. (D) Analysis of Gene Ontology (GO) and Kyoto Encyclopedia of Genes and Genomes (KEGG) pathways. The functionally enriched GO and KEGG pathways in the EHMT2 knockdown and control groups were identified using DAVID ver. 6.8.
2. CDKN1A is a direct target of EHMT2 in colon cancer
To identify the direct target of EHMT2 for colon cancer growth, we focused on genes upregulated by EHMT2 knockdown, because EHMT2 was previously shown to be involved in the downregulation of gene expression via the formation of the heterochromatin region by H3K9 methylation [11]. We finally selected the CDKN1A gene for further analysis based on the RNA-seq results (Fig. 2A). CDKN1A is a cell cycle regulator that suppresses the cell cycle [12]. To validate CDKN1A upregulation by EHMT2 knockdown, we performed quantitative RT-PCR analysis and found induction of CDKN1A expression by EHMT2 knockdown compared to siCont (Fig. 2B). Next, we performed a ChIP assay to validate CDKN1A as a direct target of EHMT2 using an anti-H3K9 dimethylation antibody. As shown in Fig. 2C, we designed ChIP primers on the promoter regions of CDKN1A and observed that H3K9 dimethylation was significantly decreased by EHMT2 knockdown, implying that CDKN1A is a direct target of EHMT2 in colon cancer. In the TCGA portal, CDKN1A expression was dramatically reduced in colon cancer tissues, and the expression patterns of EHMT2 and CDKN1A showed a reverse correlation (Fig. 2D and 2E). Together, overexpression of EHMT2 directly suppressed CDKN1A expression, thereby inducing colon cancer growth.
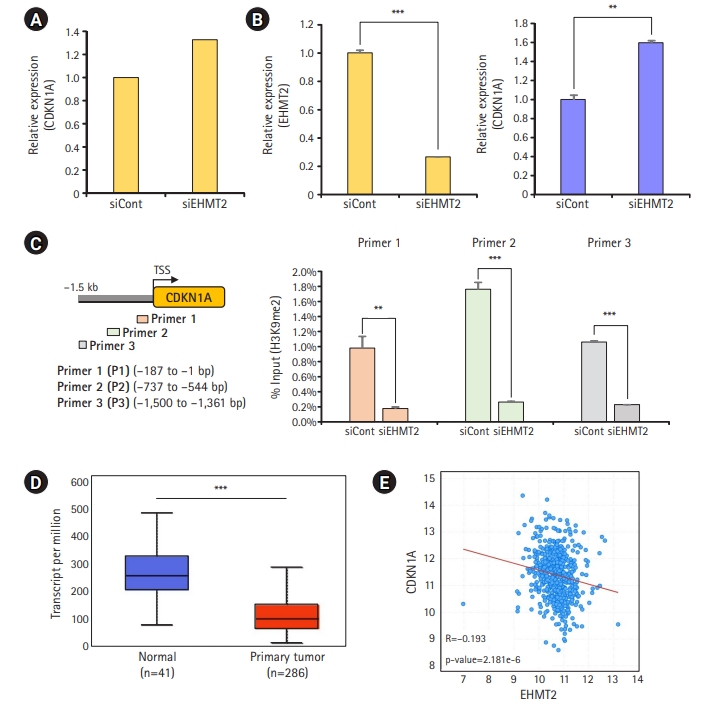
CDKN1A is a direct target of EHMT2 in colorectal cancer. (A) RNA-sequencing analysis of CDKN1A after treatment with siEHMT2 and siCont for 48 hours in HCT116 cells. (B) Quantitative real-time polymerase chain reaction analysis of EHMT2 (left) and CDKN1A (right) after treatment with siEHMT2 and siCont in HCT116 cells. Mean±standard deviation (SD) of three independent experiments. P-values were calculated using the Student t-test (***p<0.001, **p<0.01). (C) Graphical presentation of chromatin immunoprecipitation (ChIP) primer design on the CDKN1A promoter region (left). The ChIP assay was performed using an anti-H3K9me2 antibody. The results are expressed as a percentage of input chromatin compared with the control in HCT116 cells after siEHMT2 treatment (right). Mean±SD of three independent experiments. p-values were calculated using the Student t-test (***p<0.001, **p<0.01). (D) Box plot of CDKN1A expression in colorectal cancer and normal samples from The Cancer Genome Atlas. p-values were calculated using the Student t-test (***p<0.001) (http://ualcan.path.uab.edu/index.html). (E) Scatter plots of EHMT2 and CDKN1A in the cBioPortal. Each dotted line indicates a linear regression line of the expression of EHMT2 and CDKN1A. p-values and correlation coefficients (r) between 2 genes were obtained using the Pearson correlation method (https://www.cbioportal.org/).
3. Validation of CDKN1A regulation by EHMT2 in 3D culture models
Three-dimensional culture models, such as cell spheroids and organoids, show more similar biological responses to in vivo models than 2-dimensional (2D) culture systems [13–15]. Thus, to confirm EHMT2 regulation in more detail, we constructed a 3D spheroid model with HCT116 cells. After treatment with siEHMT2, we cultured HCT116 cells on a ULA plate to construct cell spheroids. As shown in Fig. 3A, although the cell spheroids in the siCont group showed more strong cell aggregation, the spheroids in the siEHMT2 treatment group showed loose cell aggregation over 2 days, implying that EHMT2 knockdown clearly affected cell junctions and cell death. In the quantitative RT-PCR analysis with a 3D spheroid model, the expression level of CDKN1A was increased by siEHMT2 treatment, as shown in the 2D culture model. Moreover, the expression of CDH1, which is an EMT marker, clearly decreased in the siEHMT2 spheroid group (Fig. 3B), suggesting that EHMT2 knockdown suppressed cell aggregation in the ULA plate via suppression of cell growth.

CDKN1A is regulated by siEHMT2 in a 3D spheroid culture system. (A) Three-dimensional spheroid formation assay with HCT116 cells. Cells transfected with siEHMT2 and siCont were loaded onto ultralow attachment plates and incubated for 2 days. The cells were photographed under a microscope each day. Scale bar, 200 μm. (B) Quantitative real-time polymerase chain reaction analysis of EHMT2, CDKN1A, and CDH1 expression after transfection with siEHMT2 at 2 days. p-values were calculated using the Student t-test (***p<0.001, **p<0.01). (C) Three-dimensional spheroid formation assay with HCT116 cells. Cells transfected with siEHMT2, siCont, and siEHMT2/siCDKN1A were loaded onto ultralow attachment plates and incubated for 48 hours. The cells were photographed under a microscope each day. Scale bar, 200 μm. (D) Quantitative real-time polymerase chain reaction analysis of EHMT2, CDKN1A, and CDH1 at 2 days. Mean±SD of 3 independent experiments. p-values were calculated using the Student t-test (***p<0.001, *p<0.05).
Next, we again validated CDKN1A regulation by EHMT2 in a 3D spheroid model. After cotreatment with siEHMT2 and siCDKN1A, we assessed cell aggregation and CDH1 expression levels in spheroid models. As shown in Fig. 3C, the aggregation of spheroids was loosened by EHMT2 knockdown compared to transfection with siCont; however, cotreatment with siEHMT2 and siCDKN1A recovered the loosened spheroid phenotype induced by siEHMT2. Additionally, the quantitative RT-PCR analysis showed that the reduction in CDH1 expression by EHMT2 knockdown was recovered by cotreatment with siEHMT2 and siCDKN1A (Fig. 3D). Thus, we suggest that CDKN1A regulation by EHMT2 is associated with colon cancer growth.
4. BIX01294 treatment induced CDKN1A expression and growth suppression in a cell spheroid model
BIX01294 is an EHMT2-specific inhibitor that suppresses H3K9 methylation [4]. As shown by EHMT2 knockdown, BIX01294 inhibited cell aggregation in ULA plates compared to DMSO treatment as a negative control (Fig. 4A). Moreover, after BIX01294 treatment of spheroids, CDKN1A expression was significantly induced, and CDH1 expression decreased, suggesting that the inhibition of EHMT2 enzyme activity also suppressed colon cancer growth (Fig. 4B). Thus, an EHMT2-specific inhibitor should be developed for colon cancer treatment.

CDKN1A is regulated by BIX01294 in a 3-dimensional (3D) spheroid culture system. (A) Three-dimensional spheroid formation assay with HCT116 cells. Cells treated with 20 µM BIX01294 and DMSO were loaded onto ultralow attachment plates and incubated for 2 days. The cells were photographed under a microscope each day. Scale bar, 200 μm. (B) Quantitative real-time polymerase chain reaction analysis of CDKN1A and CDH1 after BIX01294 treatment at 2 days. Mean±standard deviation of 3 independent experiments. p-values were calculated using the Student t-test (**p<0.01). (C) Schematic summary of the model.
Discussion
Histone H3K9 methylation by EHMT2 reduced gene expression by inducing the heterochromatin structure. In various cancers, EHMT2 methylation of H3K9 has been associated with the downregulation of tumor suppressor and anti-metastatic genes involved in cell cycle progression, proliferation, and metastasis [4–6,8,10,16]. In this study, we showed that the expression of the cyclin-dependent kinase inhibitor CDKN1A was controlled by EHMT2-related histone methylation. Several papers have reported that the upregulation of CDKN1A induces cell cycle arrest and apoptosis in cancer cells and normal cells [17–21]. Additionally, our team reported that the upregulation of CDKN1A by PRMT1 and EHMT1 knockdown induced cell apoptosis in hepatocellular carcinoma and lung cancer [22,23]. Thus, we clearly observed the upregulation of CDKN1A expression at the transcriptional level after EHMT2 knockdown. The reduction in upregulated CDKN1A expression by EHMT2 knockdown increased the cell aggregation induced by CDKN1A siRNA treatment in the colon cancer spheroid model. Thus, in the suppression of colon cancer growth, inhibition of EHMT2 by siRNA or specific inhibitors was clearly associated with the upregulation of antitumor growth-related genes, including genes involved in cell cycle arrest.
3D culture models, such as patient-derived organoids and spheroid culture models, are recognized as alternative cancer research models because 3D culture closely reflects the physiological conditions of cancer [13,14]. Thus, researchers have often used 3D culture models to evaluate therapeutic targets for cancer treatment. In this study, we first identified the EHMT2 target by examining a 2D culture model. Subsequently, we validated the functions of EHMT2 and CDKN1A using the HCT116 spheroid model. Although we used the spheroid model in our study, this model still has several limitations, such as the absence of the tumor microenvironment (TME) and heterogeneity, and these factors need to be examined to fully elucidate the function of EHMT2 in colon cancer. Thus, we need a more complex cell culture system, including TME or patient-derived colon cancer organoids, for the development of anticancer therapeutic targets. In addition, by using these models, we will obtain more accurate cancer targets and determine the MOA of those targets for cancer treatment.
In a previous study, we also reported that EHMT1 knockdown induced CDKN1A expression and cell apoptosis via G1 arrest in lung cancer [23]. Because EHMT1 and EHMT2 form heterodimers to perform H3K9 methylation, thereby suppressing gene expression in various cancers, we predicted that EHMT1 may be related to CDKN1A expression in colon cancer, as shown by EHMT2-related CDKN1A regulation. Thus, the double inhibition of EHMT1 and EHMT2 by specific inhibitors or cotreatment with siRNAs would inhibit colon cancer growth more effectively. Moreover, we hypothesize that tumor growth and metastasis in various types of colon cancer can be inhibited through combination therapy with EHMT1/2 inhibitors and anticancer drugs.
In conclusion, the TCGA portal showed EHMT2 overexpression in colon cancer, and we identified CDKN1A as a direct target of EHMT2. Using the HCT116 spheroid model, we confirmed that CDKN1A is regulated by EHMT2-induced epigenetic alterations. Finally, BIX01294 was also shown to cause growth suppression in the HCT116 spheroid model. Thus, we suggest that EHMT2 is an important therapeutic target for colon cancer and that the development of an EHMT2-specific inhibitor or siRNA drug will be important for colon cancer patients (Fig. 4C).
Notes
Conflict of interest
No potential conflict of interest relevant to this article was reported.
Funding
This work was supported by a grant from the Technology Innovation Program (No. 20008777) funded by the Ministry of Trade, Industry & Energy (MOTIE, Korea), a National Research Foundation of Korea (NRF) grant funded by the Ministry of Science, ICT, and Future Planning (NRF-2020R1A2B5B01002028, NRF-2018M3A9H3023077 /NRF-2021M3A9H3016046, NRF-2022R1A2C1003118), a Korean Fund for Regenerative Medicine (KFRM) grant funded by the Korean government (the Ministry of Science and ICT, the Ministry of Health & Welfare, 21A0404L1), and the KRIBB Research Initiative Program. The funders had no role in the study design, data collection or analysis, decision to publish, or preparation of the manuscript.
Author contributions
Conceptualization: DSK, MYS, HSC; Data curation: MYS, HSC; Formal analysis: KK, DSK; Funding acquisition: MYS, DSK, HSC; Investigation: KK; Methodology: KK; Project administration: HSC; Resources: MYS; Supervision: HSC; Validation: KK; Visualization: KK; Writing-original draft: KK; Writing-review & editing: DSK, MYS, HSC.
Data availability
The dataset files are available from Harvard Dataverse at https://doi.org/10.7910/DVN/NOVYRV.
Data availability
Please contact the corresponding author for data availability.