Organoid > Volume 3; 2023 > Article
Song, Ko, Choi, Jeon, and Kim: Tumor spheroid-based and microtumor-based vascularized models for replicating the vascularized tumor microenvironment

Abstract

Background

Tumor vasculature is a crucial pathway for supplying nutrients and oxygen to tumors during their progression, as well as facilitating the delivery of anticancer drugs or immunotherapeutic agents. Microfluidic technology has emerged as a powerful tool in creating microenvironments within 3-dimensional cell cultures that more closely resemble in vivo conditions, by enabling precise control of fluid flow. As a result, microfluidic devices have made significant progress in replicating both the structural and functional characteristics of the tumor microenvironment in vitro.

Methods and Results

In this study, we present two approaches for reconstructing the tumor vasculature using tumor spheroids or microtumors, with a particular focus on in vivo functional mimicry and experimental reproducibility. Tumor spheroid-based vascular models provide an observatory window into tumor vasculature centered on tumor spheroids, enabling quantitative measurement of the degree of abnormality of blood vessels developing around the tumor spheroid and the invasiveness of metastatic tumors. Microtumor-based vascular models, on the other hand, have the potential to enhance our comprehension of advanced and metastatic cancers at the single-cell level by elucidating the proliferative and metastatic capacities of tumor cells, as well as the vascular permeability that is contingent upon the subtypes of tumor cells.

Conclusion

Our platforms provide valuable insights into the development of novel in vitro models for studying the tumor microenvironment and advancing our understanding of cancer biology.

Introduction

Cancer occurs when abnormal cells rapidly proliferate excessively, followed by invasion of the neighboring organs and metastasis [1,2]. Globally, cancer is the second leading cause of death, accounting for 10 million deaths in 2020 [3]. Approximately 29.5 million new cancer diagnoses are expected by 2040, in addition to 16.4 million cancer-related deaths [4]. In addition, the national expenditures for cancer-related treatment in the United States increased from $190.2 billion in 2015 to $208.9 billion in 2020 [3,5]. Currently, cancer drugs account for 35% of drug development, an increase of 30% over the last decade [6]. Furthermore, the global market size of cancer-related therapeutic monoclonal antibodies is expected to reach $300 billion by 2025 [7]. Therefore, cancer has become a major healthcare issue that must be addressed.
New cancer-related drugs are often expensive owing to the high developmental costs. The pharmaceutical industry is characterized by very high drug attrition rates, with thousands of failed drug candidates for every successful drug candidate [8]. It is typical for a preclinical trial to include a high-throughput screening process that examines interactions with a selected cell line or target protein, followed by a low-throughput screening process that evaluates the efficacy of the drug candidate on an experimental animal or tissue over a long period of time at a high cost [9]. A considerable number of drug candidates are eliminated during the preclinical phase, and even if they pass this phase, most drugs fail in clinical trials in humans. This is because the preclinical testing process is significantly different from that in humans, indicative of an absence of appropriate preclinical trial models. The lack of suitable preclinical trial models has resulted in enormous costs associated with unnecessary and inappropriate trials. Moreover, this suggests that patients using newly developed drugs in the clinical phase may experience unexpected side effects.
Conventional 2-dimensional (2D) petri-dish-based culture has the advantages of low cost, simplicity, and reproducibility; however, it cannot reflect the cellular microenvironment in humans, such as cell-cell interactions, extracellular matrix (ECM) interactions, and dynamic fluid conditions with various growth factors, hormones, and chemokines [10-12]. In addition, conventional in vivo animal testing plays an important role in the preclinical phase; however, it also has inherent disadvantages, including ethical considerations, genetic heterogeneity with humans, and high costs [13]. With advances in microtechnology, microfluidic devices can provide an alternative to the lack of suitable preclinical models. A microfluidic device allows the co-culture of heterogeneous cell types in 3-dimensional (3D) structures and facilitates cell-cell and cell-ECM interactions alongside spatiotemporal dynamic stimulation of soluble factors [14-16]. Microfluidics-based tissue models, termed organs-on-a-chip, are useful for evaluating the efficacy of a drug because they allow the decoupling of only a desired aspect of an organ or tissue and control the delivery of drugs in a spatiotemporally dynamic manner [17,18].
In recent years, studies have been conducted to recapitulate the tumor microenvironment (TME) using microfluidic devices [19,20]. The TME refers to the environment around a tumor, which consists of the ECM, blood vessels surrounding the tumor, stromal cells, and immune cells [21]. The TME affects various aspects of tumor progression and treatment. For example, it plays a key role in the development of malignancies [22]. In addition, the characteristics of the TME can provide resistance to anticancer drugs [23]. Tumor-specific ECM structures and tumor-driven capillary formation are known to induce tumor metastasis [24]. Therefore, the TME is becoming increasingly recognized as a key factor in understanding tumor progression and developing therapeutic methodologies [25]. Given the recent emergence of the importance of the TME, studies have attempted to implement key features of TME in engineered platforms. Tumor-induced angiogenesis is one of the main features of the TME, which recruits capillaries toward solid tumors by releasing vascular endothelial growth factor (VEGF) [26]. The blood vessels generated by tumor-secreted VEGF exhibit structural and functional abnormalities, and they are, thus, referred to as “aberrant vasculature” [25]. This aberrant vasculature affects all elements of the TME, including cells, the ECM, and extracellular molecules, which are essential for the initiation, progression, and dissemination of tumors [27]. Chung et al. [28] reported the effect of paracrine interactions between tumor stromal cells on blood and lymphatic vessel formation. Nashimoto et al. [29] introduced vascularized breast cancer tumor spheroids on a microfluidic device and validated the effect of paclitaxel on tumor spheroids with and without vasculature. They confirmed that the effect of anticancer drugs on spheroid volume was not mediated in a dose-dependent manner under perfusion conditions, thereby demonstrating the importance of fluid flow via the vascular network. Furthermore, Haase et al. [30] developed a 3D vascularized tumor model using ovarian and lung cancers, which demonstrated significant changes in the blood vessel density and barrier function. They also validated paclitaxel uptake using diffusivity measurements, functional efflux assays, and fluorescent-conjugated drug accumulation. The vascularized tumor model described above utilized readily formed cancer spheroids. A cancer spheroid is a form of cancer cell aggregate that is a few hundred micrometers in size [31]. Given the multicellular structure of a cancer spheroid, it can mimic the in vivo-like tumor architecture as well as drug resistance, resulting in a more physiologically relevant model than conventional culture dish-based 2D models [32]. In a recent study, Kim et al. [33] proposed an injection-molded microfluidic device that implements a one-step process involving cancer spheroid formation and subsequent vascularization within a single chip.
Microtumor-based vasculature models grown from individual cancer cells as seeds have recently been developed. Sobrino et al. [34] proposed co-culturing microtumors with a perfusable vascular network and evaluated the effects of anticancer drugs. They also validated that vascular-targeting drugs, such as apatinib and vandetanib, were not effective, whereas PDGFR- and Tie2-targeting drugs, such as linifanib and cabozatinib, effectively induced tumor blood vessel regression. Furthermore, Song et al. [35] produced a high-throughput microtumor vasculature model and evaluated the cytotoxicity of immune cells delivered via blood vessels. Through real-time live-cell imaging, they confirmed that the cytotoxicity of natural killer cells via blood vessel extravasation was dependent on the subtype of colorectal cancer (CRC) cells.
As described above, based on the components of the TME, 2 broad categories of models exist: tumor spheroid (Fig. 1A) and microtumor vasculature (Fig. 1B) models. Herein, we introduce the experimental procedures for each model and discuss the advantages and disadvantages, as well as possible readouts. To this end, we first describe the fabrication of each model. The features of each model in cancer cells and blood vessels are then analyzed.

Materials and Methods

Ethics statement: This study was not performed by Human resources. Therefore, exempt from institutional review board approval.

1. Microfluidic devices

Microfluidic devices were manufactured through polystyrene plastic injection molding (RnD Factory, Hwaseong, Korea). A mold made from aluminum alloy was manufactured using machining and polishing. The injection molding operation was conducted using a clamping force of 130 tons and an injection pressure of 55 bar for 15 seconds at a nozzle temperature of 220°C. The device was exposed to oxygen plasma at 5.00e−2 Torr and 100 W for 3 minutes and then bonded to a pressure-sensitive adhesive film.

2. Cell culture

Human umbilical vein endothelial cells (HUVECs; Lonza, Basel, Switzerland) cultured in endothelial growth medium 2 (EGM-2; Lonza) and human lung fibroblasts (LFs; Lonza) cultured in fibroblast growth medium 2 (FGM-2; Lonza) were used in experiments at passage 5. All CRC cell lines were cultured in Roswell Park Memorial Institute (RPMI)-1640 medium (Gibco, Waltham, MA, USA) supplemented with 10% fetal bovine serum (FBS; HyClone, Logan, UT, USA) and 1% penicillin-streptomycin (PS; Thermo Fisher, Waltham, MA, USA). All cells were incubated at 37°C, > 95% humidity, and 5% CO2.

3. Tumor spheroid preparation

Tumor spheroids were self-assembled in 96-well plates with U-shaped bottom wells (Sumitomo Bakelite, Tokyo, Japan). A 1% volume ratio of Matrigel was added to the solution, which was resuspended at a density of 10,000 cells per well. The cell suspension was dispensed into the well plate (150 µL) and incubated for 2 days. In the angiogenesis assay, spheroids were formed from a cell suspension composed of tumor cells (adenocarcinoma gastric cell line [AGS]) and LFs at 100:1 ratio.

4. Cell seeding

We used fibrin hydrogel as an ECM to reconstruct the 3D tumor vasculature. Fibrin gel solution (10 mg/mL) was prepared by dissolving fibrinogen from bovine plasma (Sigma-Aldrich, St. Louis, MO, USA) in phosphate-buffered saline (PBS; HyClone). Then, the fibrin gel solution was mixed with aprotinin (4 TIU/mL) at a volume ratio of 25:4. The cells were mixed with the prepared fibrin hydrogel solution at a volume ratio of 3:1. Therefore, the final fibrin concentration was 2.5 mg/mL, which is an optimal concentration for angiogenesis.
To generate the tumor spheroid-based vasculature, spheroids were collected from U-shaped 96-well plates 4 to 5 days after plating. The tumor spheroid and LF cell suspension were then mixed with the fibrinogen solution and thrombin at a concentration of 2×10⁶ cells/mL. The mixture of spheroids and fibrinogen solution was immediately introduced into the microchannel of the device and incubated for 20 minutes for gelation (Supplementary Video 1). A mathematical analysis of the liquid patterning for each device has been described in our previous research [36,37].
To generate microtumor-based vasculature, HUVECs, LFs, and cancer cells were mixed with the fibrin hydrogel solution at final concentrations of 6×10⁶, 2×10⁶ and 2×10⁵ cells/mL, respectively. The cellular hydrogel solution was then mixed with thrombin solution (0.5 U/mL) at a volume ratio of 50:1 and loaded inside the microchannel before gelation. The fibrin gel solidifies within approximately 5 minutes, so the gel loading process was performed as quickly as possible (Supplementary Video 2). After gelation, the medium reservoir was filled with 120 µL EGM -2 and incubated. This medium was changed daily. To validate the tumor size according to the medium conditions, EGM-2 supplemented with 10% and 20% FBS was used.

5. Immunocytochemistry

All samples were fixed with 4% (w/v) paraformaldehyde (Biosesang, Seongnam, Korea) for 15 minutes and permeabilized with 0.2% Triton X-100 (Sigma-Aldrich) for 15 minutes. Treatment with 3% bovine serum albumin was used for tumor-specific surface staining. Extracellular-specific staining was performed using fluorescein-labeled Ulex Europaeus Agglutinin I, Dylight 594 (1:1,000; Vector Labs, Newark, CA, USA). Alexa Fluor 488-tagged anti-epithelial cell adhesion molecule (EpCAM; BioLegend, San Diego, CA, USA) and Alexa Fluor 594 594- tagged anti-epithelial cell adhesion molecule (EpCAM) were used as cancer cell-specific markers. All the samples were stored in PBS at 4°C until imaging.

6. Imaging and image analysis

The fluorescence-labeled 3D tumor vasculature was imaged using a Ti2-Eclipse inverted confocal microscope with NIS element software (Nikon, Tokyo, Japan). To measure the individual cancer sizes, confocal images were Z-projected and converted into 2D binary mask images. The selected and numbered cells were considered as particles, and the size of the cancer cluster was determined using Fiji (http://fiji.sc) open-access software.

7. Vascular permeability coefficient

Samples were prepared with and without cancer cells. Prior to permeability measurements, perfusable vessels were labeled with lectin (1:2,000 dilution, Vector), and CRC cells were labeled with EpCAM (1:500 dilution; BioLegend). After removing the culture medium from the wells, a solution containing the fluorescent dye was introduced into the medium reservoirs. Inverted epifluorescence microscopy (Tie-Eclipse; Nikon) was used to image Cascade blue fluorescence (molecular weight=3 kDa) every 20 seconds for 10 minutes in a live-cell imaging chamber. Regions of interest (ROIs) were selected based on regions in which both perivascular and intravascular regions were equally distributed to measure the intensity of each ROI, and the images were analyzed using ImageJ software (ver. 2.1.0/1.53c). The vascular permeability coefficient was calculated using an equation derived from a previous study [38]. Each condition was averaged over 6 samples, and the vascular model without SW480 was used as the control.

8. Statistical analysis

Statistical comparisons were performed using GraphPad Prism software (ver. 9.0; GraphPad Software Inc., San Diego, CA, USA). The unpaired Student t-test was used to determine significance in Fig. 2. One-way analysis of variance (ANOVA) with multiple comparisons was used to obtain the statistical values shown in Fig. 3 and compared the mean of each column with the mean of every other column The p-value thresholds for statistical significance were set at p<0.05, p<0.01, p<0.001, p<0.0001 and ns (non-significant). The standard deviation (SD) is presented as an error bar.

Results

1. In vitro modeling of tumor spheroid-based microvasculature

Tumor spheroids recapitulate key characteristics of the avascular TME. We developed a microfluidics-based 3D vascularized tumor model by incorporating a readily formed tumor spheroid into a microfluidic device. The endothelial cells embedded or attached to the gelated hydrogel surfaces spontaneously formed a vascular network. This approach promotes the interaction between the key components of the TME, such as the tumor and vasculature, through cell-tissue and cell-ECM interactions.
Previously, we established the mass production of injection-molded microfluidic chips for high-throughput 3D cell culture. In brief, we utilized a 3D printing technique to optimize the design of cell culture microchannels by considering microfluid behavior. Subsequently, a mass production protocol was established with consideration of the design factors that allow injection molding [36,37]. The device we used had a hole at the center through which the tumor spheroids or organoids could be introduced, enabling the co-culture of key tumor-associated cells, including endothelial cells, in a 3D hydrogel matrix. Vascularization of the tumor spheroids was achieved through vasculogenesis (Fig. 2A-i and angiogenesis (Fig. 2A-ii). Vasculogenesis, defined in this system, is a process in which de novo formation of a primitive vascular network from endothelial cells is embedded in the hydrogel matrix by self-assembly. By contrast, angiogenesis refers to the sprouting or branching of capillaries from the preexisting blood vessels. In our platform, vasculogenesis is induced by embedding endothelial cells within the 3D matrix, whereas angiogenesis is initiated by attaching endothelial cells to the surface of the gelated matrix. In both cases, the self-assembled and sprouted capillaries had a luminal structure, suggesting the presence of functional perfusable blood vessels (Fig. 2A-iii). Vascularization of tumor spheroids develops when endothelial cells and readily formed tumor spheroids are implanted within the fibrin matrix. The matrix provides vascular niches for physicochemical interactions with tumor spheroids and accelerates angiogenesis when LFs are co-cultured. The vascular network formed over a large area showed different morphological properties depending on its distance from the tumor spheroid. We classified the regions implanted with tumor spheroids into proximal, intermediate, and distal by distance (Fig. 2B). To quantitatively define the regions, we carried out a surface plot of a fluorescent channel expressing EpCAM conjugated to tumors (Supplementary Fig. 1). In the case of the tumor spheroid formed from a gastric cancer cell line (AGS), we found that the endpoints of blood vessels (i.e., blood vessel tips) were significantly observed in the proximal region. In contrast, the vascular density or relative vessel length decreased as they approached the tumor spheroid (Fig. 2C).
In the case of tumor angiogenesis, endothelial cells were attached to the gelated hydrogel surface in advance. Tumor angiogenesis is initiated and progresses by migration, proliferation, and self-assembly among endothelial cells, forming new capillaries towards the tumor spheroid. Since this model is advantageous for the quantitative evaluation of vascular sprouting in tumor spheroids, it can index characteristics such as the angiogenic capacity of each tumor type [39,40].

2. In vitro modeling of microtumor-based microvasculature

The 3D microtumor-based microvasculature was reconstructed by co-culture of endothelial cells, fibroblasts, and cancerous cells. Although we used an injection-molded microfluidic chip in this experiment, there are no restrictions on the types of devices that can be used for this co-culture method. Reconstructing the microtumor-based vasculature is possible if there is sufficient space to pattern the hydrogel at specific concentrations and proportions of cells. We used 30:10:1 as a ratio for endothelial cells, fibroblasts, and cancer cells. In total, 6,000 endothelial cells, 2,000 fibroblasts, and 200 cancer cells were seeded in each chip. The number of cells can be adjusted according to the dimension of the hydrogel patterned area; however, the proportion of each cell remains constant. In this respect, this method is simple, robust, and reproducible compared with spheroid-based vasculature.
In addition, according to our previous paper, cancer cells divide rapidly and release a large amount of acidic products; this causes the cellular environment to become too acidic, resulting in poor blood vessel formation [41]. Considering the high proliferation rate of cancer cells, we optimized the ratio of endothelial, fibroblast, and cancer cells to 30:10:1 and confirmed the robustness of the microtumor-based vasculature formation.
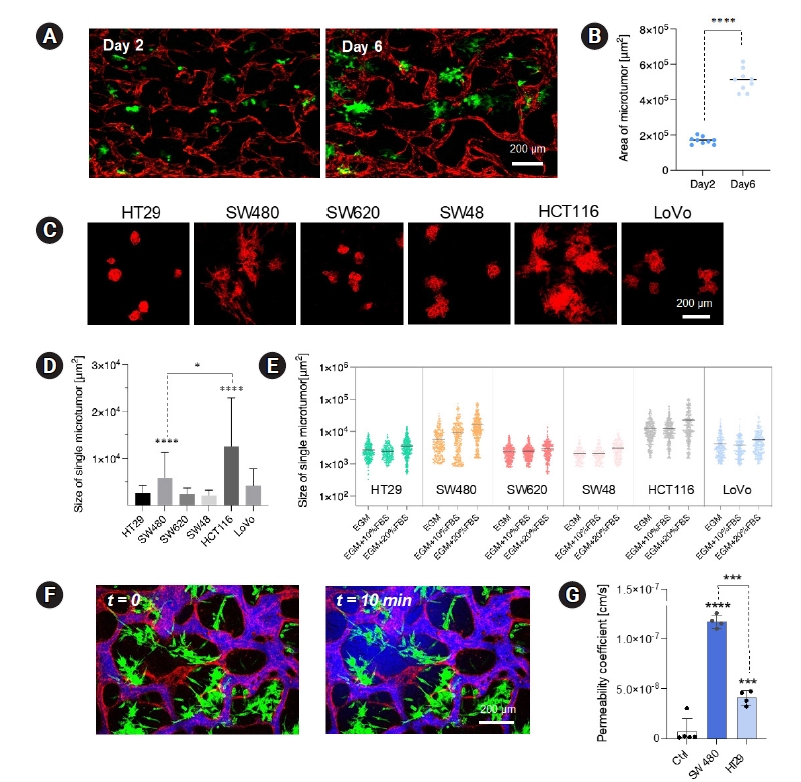
According to time-course confocal imaging, aggressive division of cancer cells and blood vessel formation near the microtumor were observed in our microtumor-based vasculature model (Fig. 3A). In the confocal image taken on day 2, a significant number of cancer cells had proliferated from the single cells 48 hours after of cell loading. Additionally, when images taken on days 2 and 6 were compared, the size of the microtumors gradually increased over time (Fig. 3B). Interestingly, the size and morphology of the microtumors varied significantly depending on the subtype of CRC (Fig. 3C). A microtumor refers to a small-sized tumor spheroid that is grown from individually seeded tumor cells. During culturing, single tumor cells spontaneously proliferated and formed 3D spheroid-like structures; however, their size was smaller (100-200 µm) than that of general tumor spheroids (500 µm). As a result, the spontaneously grown microtumors were embedded within a 3D extracellular matrix near the blood vessels (Supplementary Fig. 2A). A cross-sectional view of the HT29 microtumor is shown in Supplementary Fig. 2B. When cultured in EGM-2 medium, SW480 and HCT116 microtumors exhibited large, sparse morphologies, whereas the other CRCs displayed small, aggregated morphologies (Fig. 3D). As shown in the images, some tumor cell lines, such as SW480 and HCT116, were larger than other CRC cell lines. Such differences in growth patterns may be attributed to a multitude of factors, such as genetic information. The genetic mutation information is provided in Supplementary Fig. 3. We also measured the size of individual microtumors under different medium conditions (Fig. 3E). Because the nutrient consumption of cancer cells is much higher than that of endothelial cells or fibroblasts, we determined the optimal medium conditions for co-culture. Nonetheless, the SW480 and HCT116 cells were relatively large when compared with other CRC subtypes in all medium conditions. In particular, the average size of the SW480 microtumors increased from 5.7×103 μm2 under the EGM-2-only condition to 1.2×104 μm2 under EGM-2 supplemented with 10% FBS and 1.6×104 μm2 under EGM-2 supplemented with 20% FBS. Except for SW480 cells, most cells did not show a significant change in the size of microtumors when treated with EGM-2 supplemented with 10% FBS, but they showed a slight increase in size when treated with EGM-2 supplemented with 20% FBS, suggesting the growth-promoting capability of FBS.
We also measured the permeability of the microtumor-based vasculature. We compared the permeability of the blood vessels with and without the microtumor. Time-series confocal images of the tumor vasculature are shown in Fig. 3F. Cascade blue (3 kD) was used as a fluorescent dye to measure the permeability in the perivascular regions. According to the following equation, the permeability coefficient p was calculated as follows:
P=1Iw×dI/dtIj
Where Iw is the length of the blood vessel wall that separates the perivascular and intravascular areas. I is the total intensity in the perivascular area and Ij is the mean intensity in the intravascular region. Our previous research provided a more detailed derivation of this equation [37]. When the microtumors were co-cultured with the microvasculature, we observed a slight increase in fluorescence intensity in the perivascular region due to dye leakage through the blood vessel barriers (Fig. 3G).

Discussion

Engineering in vitro vascularized tumor models is becoming increasingly important in cancer research. In addition, recent advances in microfluidic technology offer added advantages in the co-culture of heterogeneous cell types in a 3D microenvironment, facilitating cell-to-cell and cell-ECM interactions. As the microfluidic technique mimics the structural and functional characteristics of the TME, it reflects how the tumor interacts with its surrounding environment.
Tumor progression in vivo involves the formation of blood vessels around the tumor for supplying nutrients and removing waste materials. Furthermore, the tumor vasculature often serves as a route for hematogenous metastasis, which is why blood vessel research is imperative to further cancer research in the future.
Here, we introduced 2 different approaches to generate tumor vasculature in vitro: tumor spheroid-based microvasculature and microtumor-based microvasculature. Each technique has distinct advantages and disadvantages in terms of their mimicry of vasculature structure and function.
The tumor spheroid-based vasculature model can be implemented in various ways, including vasculogenesis, angiogenesis, and the formation of vascular lumens in ECM niches. AGS cells were first used to demonstrate the reproducibility of our model, regardless of the type of cancer cell. After confirming reproducibility, an identical tumor vascularization experiment was performed using one type of CRC cells (Supplementary Fig. 4A). Based on our results, we could quantify the features of the blood vessels near a gastric tumor spheroid depending on their distance from the tumor. These results indicated an interaction between tumor spheroids and endothelial cells. Furthermore, we confirmed angiogenic sprouting toward the gastric tumor spheroid. The endothelial cells attached to the surface of the hydrogel migrated toward the tumor spheroid and sprouted into the matrix over time. During this experiment, structural characteristics, such as volume, length, and the number of sprouts, were not quantified. However, it was confirmed that the blood vessels formed around the tumor spheroid did not simply surround the spheroid, but penetrated the inside of the spheroid (Supplementary Fig. 4B).
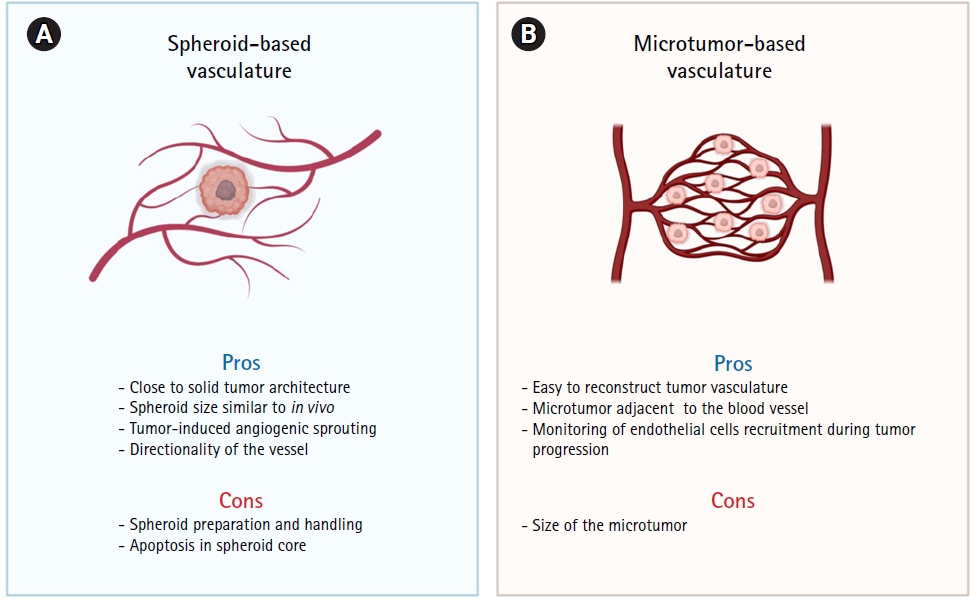
Recent advances in imaging technologies have enabled the visualization of in vivo tumor vasculature. Toi et al. [42] developed a photoacoustic imaging system to visualize the morphological characteristics of blood vessels in and around human breast cancers. They observed blood vessels inside the tumors, and intratumoral blood perfusion was confirmed. Several studies have successfully visualized tumor-associated blood vessels using intravital multiphoton microscopy in mouse xenograft models [43-45]. These results collectively indicate that blood vessels do not simply form on solid tumor surfaces, but also penetrate the tumors. Importantly, our model used an engineered platform that accurately reflected the blood vessel-solid tumor interactions. We believe that our spheroid-based tumor vascular model has great potential for evaluating the efficacy of anticancer or antiangiogenic drugs in tumors and near blood vessels. The use of the spheroid-based tumor vasculature model offers several advantages, including its ability to mimic solid tumor architecture, directional angiogenic sprouting, and recapitulation of tumor size in vivo (Fig. 4A). However, using this model requires additional processes, such as the preparation and handling of tumor spheroids. Moreover, as the spheroid size increases, apoptosis of the spheroid core must be addressed.
In contrast, microtumor-based vasculature provides a more robust and simpler way to reconstruct vascularized microtumor models (Fig 4B). Unlike other approaches, there is no need to transport and transplant tumor spheroids, ensuring high experimental reproducibility as the only requirement is to prepare a given cell combination in a specific proportion. Based on confocal images, we confirmed that this model can mimic tumor progression, including tumor cell proliferation from a single cell. As the cells constituting the microtumor proliferate from a single tumor cell, they share an identical genetic background. Thus, the microtumor-based approach is favorable for the preparation of vascularized tumor models using patient-derived samples. Tumor cells composed of in vivo solid tumors harbor diverse genetic mutations; thus, a single cell-based microtumor can help screen tumor cells based on genetic background. (Fig. 3A).
In addition, microtumor-based vasculature reflects the different growth rates and proliferation kinetics of different cancer cell types. For instance, SW480 and HCT116 cells showed higher proliferation rates and formed larger microtumors under the same culture conditions (Fig. 3B and 3D). Because a microtumor forms adjacent to a blood vessel, the larger it is, the greater its chances of interacting with the blood vessel. These characteristics may contribute to elucidating the underlying mechanisms of crosstalk between blood vessels and tumors. We also validated the effect of the culture medium on microtumors. A higher proportion of FBS resulted in an increase in the microtumor size (Fig 3C). Moreover, we validated the permeability of blood vessels by comparing the permeability coefficients of the normal and tumor vessels. We confirmed that the permeability of tumor vessels is significantly increased, leading to aberrant tumor vasculature. We also compared the permeability coefficients of the tumor vasculature according to CRC subtypes. We compared SW480 with HT29; interestingly, the permeability coefficient of SW480 was much higher than that of HT29. Evidently, the vascularized tumor model can reflect the differences in vascular permeability depending on the subtypes of CRC, even with identical endothelial cells, highlighting its potential for developing patient-specific vascularized tumor models.
However, microtumor-based vasculature models have innate limitations. In this case, drug resistance was reduced because the tumor size was smaller than that observed in vivo. Moreover, we cultured the microtumor-based vasculature in an injection-molded microfluidic device for 5 days. Although we wanted to see the effects of longer culture duration, due to the limited volume of the reservoir, lactic acid produced by cancer cells deteriorated the reconstructed blood vessels, making long-term observations impossible. Nevertheless, this issue can be solved by increasing the volume of the reservoir or culturing with the flowing medium, which should be investigated in future studies.
In conclusion, we demonstrated 2 approaches for modeling the vascularized TME: tumor spheroid-based and microtumor-based vascularized models. Each model has its own distinct advantages and disadvantages. Therefore, it is essential to select the appropriate model according to the purpose of the experimental study. We expect that our in vitro tumor vasculature model will contribute to the understanding of underlying cancer mechanisms and patient-specific drug screening.

Supplementary Information

Supplementary materials are presented online (available at https://doi.org/10.51335/organoid.2023.3.e6).

Supplementary Fig. 1.

Classification of the tumor microenvironment by distance from a tumor spheroid. (A) EpCAM-specific fluorescence images extracted from a tumor spheroid-based tumor vasculature model. (B, C) Graphs showing the fluorescence intensity of tumor cells labeled with EpCAM. The median intensity level of the tumor spheroid region is approximately 20.28%. The region where the intensity decreases, indicating a decrease in the tumor cell population, was designated as intermediate. Finally, the point at which the intensity level is saturated was defined as the distal region. EpCAM, epithelial cell adhesion molecule.
organoid-2023-3-e6-Supplementary-Fig-1.pdf

Supplementary Fig. 2.

Three-dimensional (3D) confocal image of microtumor-based vasculature. (A) Z-projection image of microtumor vasculature using HT29 (left) and a 3D view (right). (B) Cross-sectional view of the HT29 microtumor.
organoid-2023-3-e6-Supplementary-Fig-2.pdf

Supplementary Fig. 3.

Genetic information of colorectal cancer cells.
organoid-2023-3-e6-Supplementary-Fig-3.pdf

Supplementary Fig. 4.

Spheroid-based tumor vasculature using colorectal cancer cells. (A) Spheroid-based tumor vasculature using the SW480 cell line. (B) 20× image of the white rectangular area to show vascular infiltration inside the tumor spheroid.
organoid-2023-3-e6-Supplementary-Fig-4.pdf

Supplementary Video 1.

Visualization of liquid patterning for reconstructing spheroid-based vasculature (https://doi.org/10.51335/organoid.2023.3.e6.v01).

Supplementary Video 2.

Visualization of liquid patterning for reconstructing microtumor-based vasculature (https://doi.org/10.51335/organoid.2023.3.e6.v02).

NOTES

Conflict of interest

No potential conflict of interest relevant to this article was reported. Hong Nam Kim is a editorial board member of the Organoid Journal.

Funding

This study was supported by the National Research Foundation of Korea (NRF) grant funded by the Korean government (MSIT) (No. 2021R1A2B5B02086828 and No. 2021R1A3B1077481 and NRF-2022R1A6A3A01086914). Figures were created using BioRender (https://biorender.com/).

Author contributions

Conceptualization: JS, JK; Data curation: JS, JK; Formal analysis: JS, JK; Funding acquisition: NC, HNK, JS; Investigation: NC, HNK; Methodology: JS, JK; Project administration: NC, NLJ, HNK; Supervision: NC, NLJ, HNK; Writing-original draft: JS, JK; Writing-review & editing: all authors.

Data availability

Please contact the corresponding author for data availability.

Fig. 1.
Two approaches for in vitro modeling of tumor-associated microvasculature. Schematics of the in vitro (A) tumor spheroid-based vasculature and (B) microtumor-based vasculature. The tumor spheroid is larger than the microtumor. In addition, in the tumor spheroid-based approach, only one tumor spheroid is incorporated within the organ-on-a-chip, while, in the microtumor-based approach, multiple microtumors spontaneously form within the 3-dimensional hydrogel due to the continuous proliferation of individual tumor cells. Illustration and confocal microscopy representative image of (C) spheroid-based vasculature cultured for 10 days and (D) microtumor-based vasculature cultured for 5 days. The samples were stained with lectin (C, red; D, green) as a marker for endothelial cells and EpCAM (C, green; D, red) as a marker for cancer cells. EpCAM, epithelial cell adhesion molecule.
organoid-2023-3-e6f1.jpg
Fig. 2.
Tumor spheroid-based tumor vasculature modeling. (A) Schematics and representative confocal microscopy images for modeling tumor spheroids and microvasculature in vitro: (i) vascularized tumor spheroid, (ii) tumor spheroid-induced angiogenesis (green, lectin; red, EpCAM), and (iii) vascular lumen formation (red, lectin; green, 2.0 µm diameter fluorescently-labeled microbeads). (B) Segmentation of the cell culture regions within the device according to the distance from the tumor spheroid (red: EpCAM; green: lectin; blue: nuclei). (C) Quantitative evaluation of the morphological characteristics of blood vessels depending on the region. The values are shown as mean±standard deviation (n=4). Statistical significance was evaluated using the Student t-test. EpCAM, epithelial cell adhesion molecule. *p<0.05.
organoid-2023-3-e6f2.jpg
Fig. 3.
In vitro modeling of microtumor-based microvasculature. (A) Confocal microscopy images of microtumor-based vasculature depending on the culture time. In the microtumor-based approach, a single cancer cell continuously proliferates to become a microtumor. During the growth of the microtumor, endothelial cells around the microtumors form a vascular network via self-assembly (red: EpCAM, green: lectin). (B) The area of microtumors depends on the number of days in culture (n=7). Statistical significance was evaluated by one-way analysis of variance (ANOVA) with multiple comparisons. ****p<0.0001. (C) The sizes and morphologies of microtumors depend on the subtypes of colorectal cancer (red: EpCAM). (D) The size of a single microtumor in EGM-2 medium culture conditions. SW480 and HCT116 formed significantly larger microtumors (n=7 in each case). Statistical significance was evaluated by one-way analysis of variance (ANOVA) with multiple comparisons. *p<0.05 and ****p<0.0001. (E) Scattered dot plots showing the size of single microtumors. Each dot indicates the size of a single microtumor. Data are shown as mean±standard deviation (SD) (n=200). (F) Vascular permeability of SW480 microtumor-based microvasculature. Time-lapse confocal images of the leakage of fluorescent dyes from the microvasculature. The microvasculature and SW480 microtumor were stained with specific markers, respectively (red, lectin; green, EpCAM) before loading a fluorescent dye (Cascade blue, molecular weight=3 kD). (G) Comparison of the vascular permeability coefficient. The permeability coefficient of SW480 was higher than that of HT29. Data are shown as mean±SD (n=7). Statistical significance was evaluated by one-way analysis of variance (ANOVA) with multiple comparisons. *p<0.05, ***p<0.001 and ****p<0.0001. EpCAM, epithelial cell adhesion molecule.
organoid-2023-3-e6f3.jpg
Fig. 4.
Schematic overview of in vitro modeling of tumor microvasculature. (A) Pros and cons of the tumor spheroid-based microvasculature model. (B) Pros and cons of the microtumor-based vasculature model.
organoid-2023-3-e6f4.jpg

References

1. Weinberg RA. How cancer arises. Sci Am 1996;275:62-70.
crossref pmid
2. Kim Y, Stolarska MA, Othmer HG. The role of the microenvironment in tumor growth and invasion. Prog Biophys Mol Biol 2011;106:353-79.
crossref pmid pmc
3. Mariotto AB, Enewold L, Zhao J, Zeruto CA, Yabroff KR. Medical care costs associated with cancer survivorship in the United States. Cancer Epidemiol Biomarkers Prev 2020;29:1304-12.
crossref pmid pmc pdf
4. International Agency for Research on Cancer (IARC). Global Cancer Observatory: cancer tomorrow [Internet]. Lyon: IARC; Cited 11 Nov 2022. Available from: http://gco.iarc.fr/tomorrow/home.
5. Mariotto AB, Yabroff KR, Shao Y, Feuer EJ, Brown ML. Projections of the cost of cancer care in the United States: 2010-2020. J Natl Cancer Inst 2011;103:117-28.
crossref pmid pmc
6. DiMasi JA, Grabowski HG. Economics of new oncology drug development. J Clin Oncol 2007;25:209-16.
crossref pmid
7. Lu RM, Hwang YC, Liu IJ, Lee CC, Tsai HZ, Li HJ, et al. Development of therapeutic antibodies for the treatment of diseases. J Biomed Sci 2020;27:1.
crossref pmid pmc pdf
8. Brodniewicz T, Grynkiewicz G. Preclinical drug development. Acta Pol Pharm 2010;67:578-85.
pmid
9. Kumar A, Voet A, Zhang KY. Fragment based drug design: from experimental to computational approaches. Curr Med Chem 2012;19:5128-47.
crossref pmid
10. Bahcecioglu G, Basara G, Ellis BW, Ren X, Zorlutuna P. Breast cancer models: engineering the tumor microenvironment. Acta Biomater 2020;106:1-21.
crossref pmid pmc
11. AlMusawi S, Ahmed M, Nateri AS. Understanding cell-cell communication and signaling in the colorectal cancer microenvironment. Clin Transl Med 2021;11:e308.
crossref pmid pmc pdf
12. Yang Q, Xiao Z, Lv X, Zhang T, Liu H. Fabrication and biomedical applications of heart-on-a-chip. Int J Bioprint 2021;7:370.
crossref pmid pmc pdf
13. Billerbeck E, de Jong Y, Dorner M, de la Fuente C, Ploss A. Animal models for hepatitis C. Curr Top Microbiol Immunol 2013;369:49-86.
crossref pmid
14. Sung KE, Beebe DJ. Microfluidic 3D models of cancer. Adv Drug Deliv Rev 2014;79-80:68-78.
crossref pmid
15. Rijal G, Li W. 3D scaffolds in breast cancer research. Biomaterials 2016;81:135-56.
crossref pmid
16. Song J, Ryu H, Chung M, Kim Y, Blum Y, Lee SS, et al. Microfluidic platform for single cell analysis under dynamic spatial and temporal stimulation. Biosens Bioelectron 2018;104:58-64.
crossref pmid
17. Kim Y, Song J, Lee Y, Cho S, Kim S, Lee SR, et al. High-throughput injection molded microfluidic device for single-cell analysis of spatiotemporal dynamics. Lab Chip 2021;21:3150-8.
crossref pmid
18. Seo Y, Bang S, Son J, Kim D, Jeong Y, Kim P, et al. Brain physiome: a concept bridging in vitro 3D brain models and in silico models for predicting drug toxicity in the brain. Bioact Mater 2021;13:135-48.
crossref pmid pmc
19. Shang M, Soon RH, Lim CT, Khoo BL, Han J. Microfluidic modelling of the tumor microenvironment for anti-cancer drug development. Lab Chip 2019;19:369-86.
crossref pmid
20. Beckwith AL, Borenstein JT, Velásquez-García LF. Monolithic, 3D-printed microfluidic platform for recapitulation of dynamic tumor microenvironments. J Microelectromech Syst 2018;27:1009-22.
crossref
21. Baghban R, Roshangar L, Jahanban-Esfahlan R, Seidi K, Ebrahimi-Kalan A, Jaymand M, et al. Tumor microenvironment complexity and therapeutic implications at a glance. Cell Commun Signal 2020;18:59.
crossref pmid pmc pdf
22. Wang M, Zhao J, Zhang L, Wei F, Lian Y, Wu Y, et al. Role of tumor microenvironment in tumorigenesis. J Cancer 2017;8:761-73.
crossref pmid pmc
23. Jo Y, Choi N, Kim K, Koo HJ, Choi J, Kim HN. Chemoresistance of cancer cells: requirements of tumor microenvironment-mimicking in vitro models in anti-cancer drug development. Theranostics 2018;8:5259-75.
crossref pmid pmc
24. Ricciuti B, Foglietta J, Bianconi V, Sahebkar A, Pirro M. Enzymes involved in tumor-driven angiogenesis: a valuable target for anticancer therapy. Semin Cancer Biol 2019;56:87-99.
crossref pmid
25. Siemann DW, Horsman MR. Modulation of the tumor vasculature and oxygenation to improve therapy. Pharmacol Ther 2015;153:107-24.
crossref pmid pmc
26. Carmeliet P. VEGF as a key mediator of angiogenesis in cancer. Oncology 2005;69 Suppl 3:4-10.
crossref pmid pdf
27. Goel S, Duda DG, Xu L, Munn LL, Boucher Y, Fukumura D, et al. Normalization of the vasculature for treatment of cancer and other diseases. Physiol Rev 2011;91:1071-121.
crossref pmid
28. Chung M, Ahn J, Son K, Kim S, Jeon NL. Biomimetic model of tumor microenvironment on microfluidic platform. Adv Healthc Mater 2017;6:1700196.
crossref pdf
29. Nashimoto Y, Okada R, Hanada S, Arima Y, Nishiyama K, Miura T, et al. Vascularized cancer on a chip: the effect of perfusion on growth and drug delivery of tumor spheroid. Biomaterials 2020;229:119547.
crossref pmid
30. Haase K, Offeddu GS, Gillrie MR, Kamm RD. Endothelial regulation of drug transport in a 3D vascularized tumor model. Adv Funct Mater 2020;30:2002444.
crossref pmid pmc pdf
31. Casey RC, Burleson KM, Skubitz KM, Pambuccian SE, Oegema TR Jr, Ruff LE, et al. Beta 1-integrins regulate the formation and adhesion of ovarian carcinoma multicellular spheroids. Am J Pathol 2001;159:2071-80.
pmid pmc
32. Desoize B, Jardillier J. Multicellular resistance: a paradigm for clinical resistance? Crit Rev Oncol Hematol 2000;36:193-207.
crossref pmid
33. Kim Y, Ko J, Shin N, Park S, Lee SR, Kim S, et al. All-in-one microfluidic design to integrate vascularized tumor spheroid into high-throughput platform. Biotechnol Bioeng 2022;119:3678-93.
crossref pmid pdf
34. Sobrino A, Phan DT, Datta R, Wang X, Hachey SJ, Romero-López M, et al. 3D microtumors in vitro supported by perfused vascular networks. Sci Rep 2016;6:31589.
crossref pmid pmc pdf
35. Song J, Choi H, Koh SK, Park D, Yu J, Kang H, et al. High-throughput 3D in vitro tumor vasculature model for real-time monitoring of immune cell infiltration and cytotoxicity. Front Immunol 2021;12:733317.
crossref pmid pmc
36. Yu J, Lee S, Song J, Lee SR, Kim S, Choi H, et al. Perfusable micro-vascularized 3D tissue array for high-throughput vascular phenotypic screening. Nano Converg 2022;9:16.
crossref pmid pmc pdf
37. Lee H, Kim S, Chung M, Kim JH, Jeon NL. A bioengineered array of 3D microvessels for vascular permeability assay. Microvasc Res 2014;91:90-8.
crossref pmid
38. Lee Y, Choi JW, Yu J, Park D, Ha J, Son K, et al. Microfluidics within a well: an injection-molded plastic array 3D culture platform. Lab Chip 2018;18:2433-40.
crossref pmid
39. Ko J, Ahn J, Kim S, Lee Y, Lee J, Park D, et al. Tumor spheroid-on-a-chip: a standardized microfluidic culture platform for investigating tumor angiogenesis. Lab Chip 2019;19:2822-33.
crossref pmid
40. Lee SY, Byeon S, Ko J, Hyung S, Lee IK, Jeon NL, et al. Reducing tumor invasiveness by ramucirumab and TGF-β receptor kinase inhibitor in a diffuse-type gastric cancer patient-derived cell model. Cancer Med 2021;10:7253-62.
crossref pmid pmc pdf
41. Fadaka A, Ajiboye B, Ojo O, Adewale O, Olayide I, Emuowhochere R. Biology of glucose metabolization in cancer cells. J Oncol Sci 2017;3:45-51.
crossref
42. Toi M, Asao Y, Matsumoto Y, Sekiguchi H, Yoshikawa A, Takada M, et al. Visualization of tumor-related blood vessels in human breast by photoacoustic imaging system with a hemispherical detector array. Sci Rep 2017;7:41970.
crossref pmid pmc pdf
43. Lathia JD, Gallagher J, Myers JT, Li M, Vasanji A, McLendon RE, et al. Direct in vivo evidence for tumor propagation by glioblastoma cancer stem cells. PLoS One 2011;6:e24807.
crossref pmid pmc
44. Perrin L, Bayarmagnai B, Gligorijevic B. Frontiers in intravital multiphoton microscopy of cancer. Cancer Rep (Hoboken) 2020;3:e1192.
crossref pmid pdf
45. Voutouri C, Kirkpatrick ND, Chung E, Mpekris F, Baish JW, Munn LL, et al. Experimental and computational analyses reveal dynamics of tumor vessel cooption and optimal treatment strategies. Proc Natl Acad Sci U S A 2019;116:2662-71.
crossref pmid pmc


ABOUT
BROWSE ARTICLES
EDITORIAL POLICY
FOR CONTRIBUTORS
Editorial Office
Room 319, Hall 1 of Chonbuk National University Dental College, 20, Geonji-ro, Deokjin-gu, Jeonju 54907, Korea
Tel: +82-63-270-4024    E-mail: editor@j-organoid.org                

Copyright © 2024 by The Organoid Society.

Developed in M2PI

Close layer
prev next